|
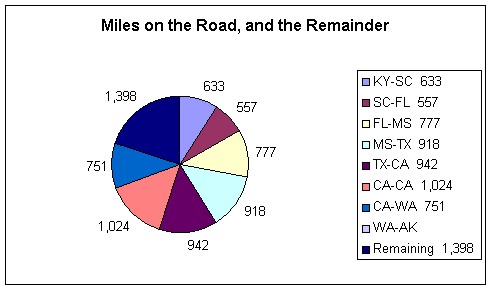
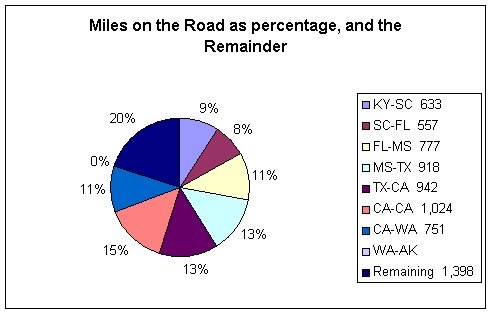
The Journey in Charts and GraphsThe Total PictureWith seven legs of the journey finished, we have gathered a great amount of information. This information is wonderfully displayed in graphs. Using pie charts you see how many miles we have pedalled per leg of the journey, as well as the remaining number of miles still ahead of us. It is also displayed in percentages.
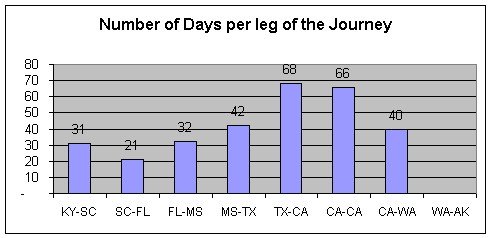
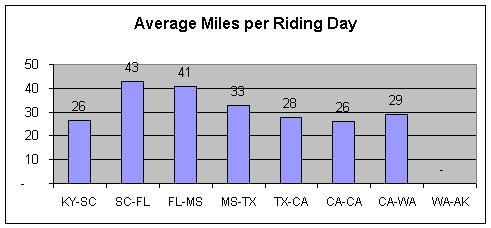
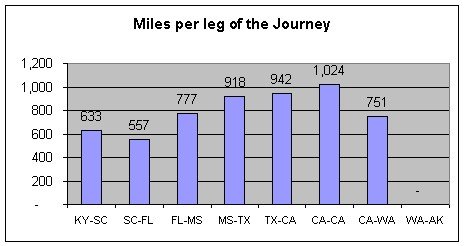
We like to know how many days it takes us per leg, as well as how many miles we average per riding day. A bar chart is the best way to display these figures.
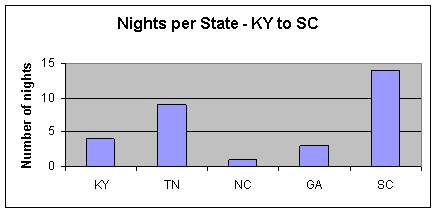
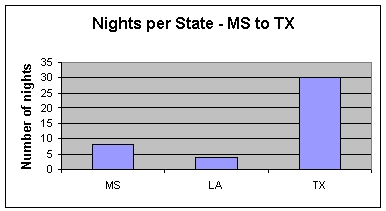
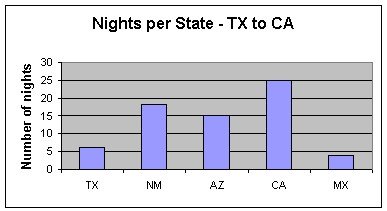
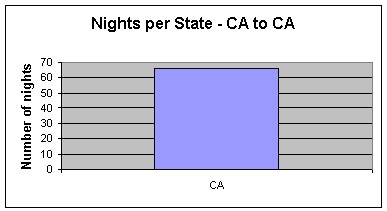
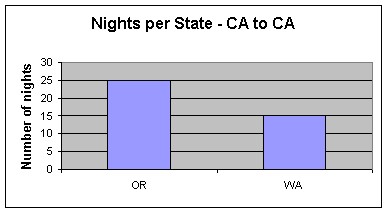
A bar chart is also useful to show how many miles per leg we've traveled, as well as how many nights we stay in each state.
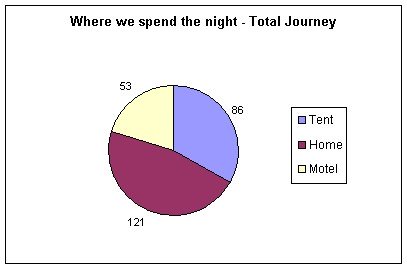
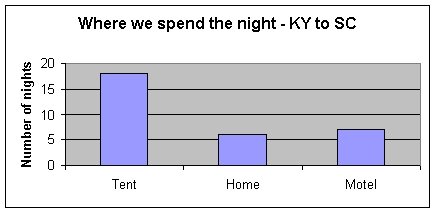
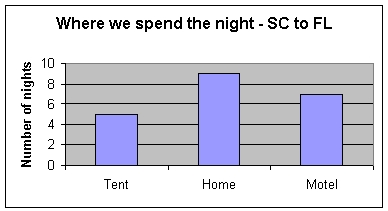
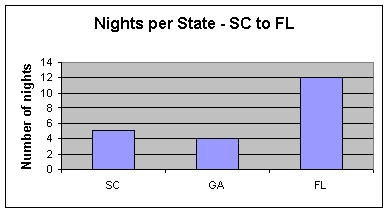
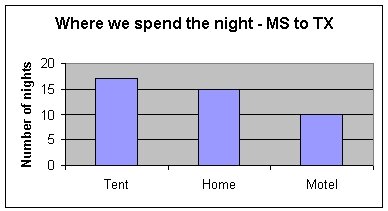
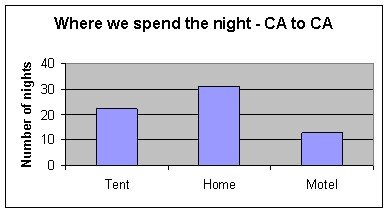
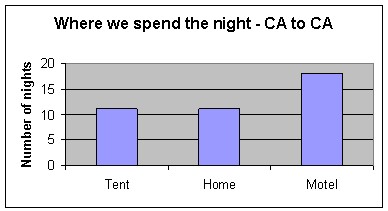
One Leg at a TimeAs we are on the road, everyday is a challenge to find a place to spend the night. We prefer spending the night in our tent. If that is not possible we find a cheap motel. From time to time we meet very special people that open their homes up to us. You can see for yourself where we spend most of our nights and in which states we have stayed the most. Leg 1: Mount Vernon, Kentucky to Charleston, South Carolina
Leg 2: Charleston, South Carolina to Fort Pierce, Florida
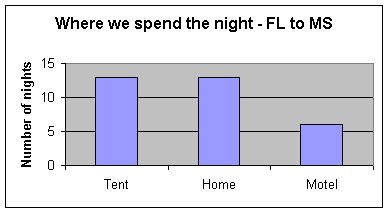
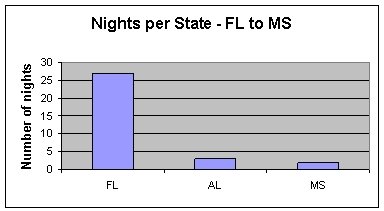
Leg 3: Fort Pierce, Florida to Lucedale, Mississippi
Leg 4: Lucedale, Mississippi to Slaton, Texas
Leg 5: Slaton, Texas to San Diego, California
Leg 6: San Diego, California to Crescent City, California
Leg 7: San Diego, California to Crescent City, California
Return to the Pedouin Home Page
|